Using TensorBoard to Visualize Image Classification Retraining in TensorFlow
tl;dr I contributed code to the Google TensorFlow project on GitHub that adds TensorBoard visualizations to the existing TensorFlow “How to Retrain Inception’s Final Layer for New Categories” tutorial. My additions make it easier to understand, debug, and optimize the retraining process. Check it out by walking through the updated tutorial, specifically the “Visualizing the Retraining with TensorBoard” section I added, or use the source code as a starting point to visualize your own TensorFlow code with TensorBoard.
Quick start
Follow the steps in this tutorial. The specific section I added is “Visualizing the Retraining with TensorBoard.”
Retraining a state-of-the-art image classification Neural Network to classify your own images in TensorFlow
A major part of my final Metis project was modifying and retraining the state-of-the-art Google Inception v3 Deep Convolutional Neural Network to classify images. The Google TensorFlow project has a great tutorial which shows you how to quickly get started retraining the Inception v3 model to classify images of flowers and then repurpose the code for your own image classification needs.
Challenges optimizing Inception v3 model retraining
Before I added TensorBoard summaries to the TensorFlow image classification tutorial, it was not possible to visualize the model architecture or compare model training performance over many training steps.
Analyzing model training performance over time
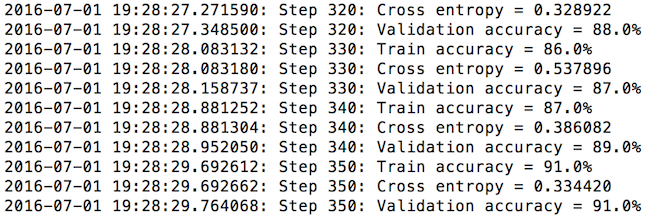
The stock TensorFlow tutorial code did a great job of printing model performance to the console such as accuracy and cross entropy. However, it was difficult to understand how the model was performing over time, especially when you trained the model for thousands of steps. Is the model converging? Is the model overfitting the data? It was difficult to select the optimal model parameters without answers to those questions. Additionally, those questions got even more difficult to answer when comparing the model performance across different parameter combinations!
Understanding the Inception v3 retraining model architecture
What about if you wanted to add TensorFlow code that modifies the Inception v3 model architecture to fit your own image classification problem? Sure, you can find some images of the Inception v3 architecture online, but understanding how it’s actually implemented in TensorFlow is a whole separate beast.
Wouldn’t it be great to visualize the model training performance and architecture to more easily understand, debug, and optimize the retraining process?
Visualizing model performance and architecture with TensorBoard
Luckily, TensorFlow includes a complementary tool for model performance and architecture visualization called TensorBoard.
To take advantage of the TensorBoard visualization capabilities, I added code to the retraining script that allows you to visualize the model training statistics and overall model architecture.
Once you execute the retraining according to the tutorial, visualizing the retrain process and model architecture is as simple as:
1
tensorboard --logdir /tmp/retrain_logs
Viewing model performance in TensorBoard
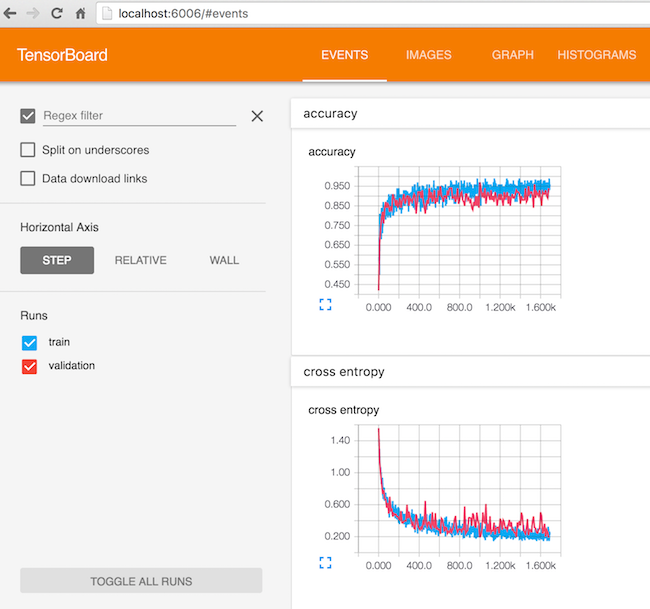
Once TensorBoard is running, selecting the EVENTS tab allows you to visualize the change in model statistics such as accuracy and cross entropy.
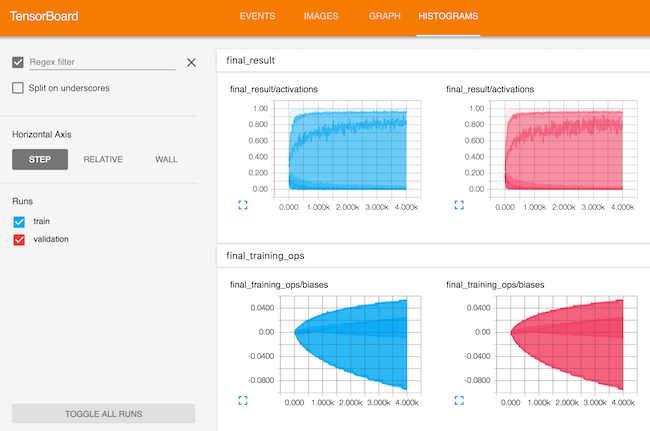
You can select the HISTOGRAMS tab to visualize the retraining layer weights, biases, activations, etc.
Comparing model training performance across multiple model parameter combinations
Want to easily compare model training performance across multiple parameter combinations? Change the TensorBoard summary directory for each model training run, keeping the same base directory (/tmp/retrain_logs in the example below).
NOTE: The following examples are run from the
tensorflow/examples/image_retrainingdirectory of the TensorFlow GitHub project
Example run 1
In this training run, let’s set the learning_rate to 0.01.
1
$ python retrain.py --image_dir ~/Downloads/flower_photos --learning_rate 0.01 --summaries_dir /tmp/retrain_logs/run1
Example run 2
In this training run, let’s set the learning_rate to 0.001.
1
$ python retrain.py --image_dir ~/Downloads/flower_photos --learning_rate 0.001 --summaries_dir /tmp/retrain_logs/run2
Launch TensorBoard
1
$ tensorboard --logdir /tmp/retrain_logs/
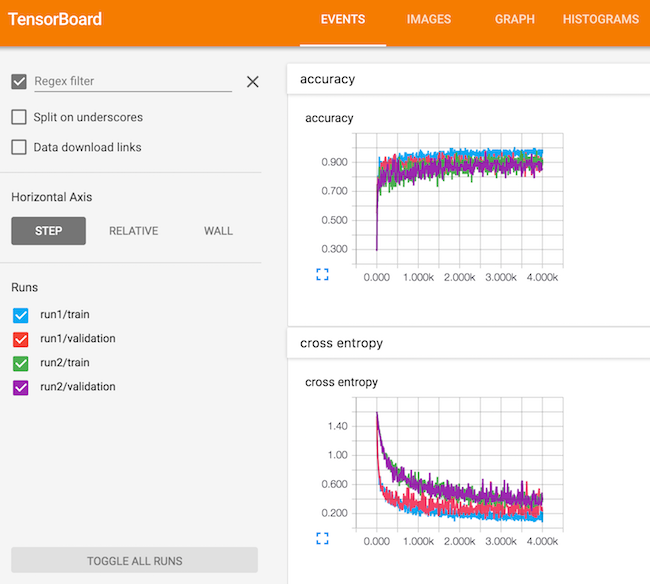
In the image below, you can easily see how changing the learning_rate from 0.01 to 0.001 affects the model training.
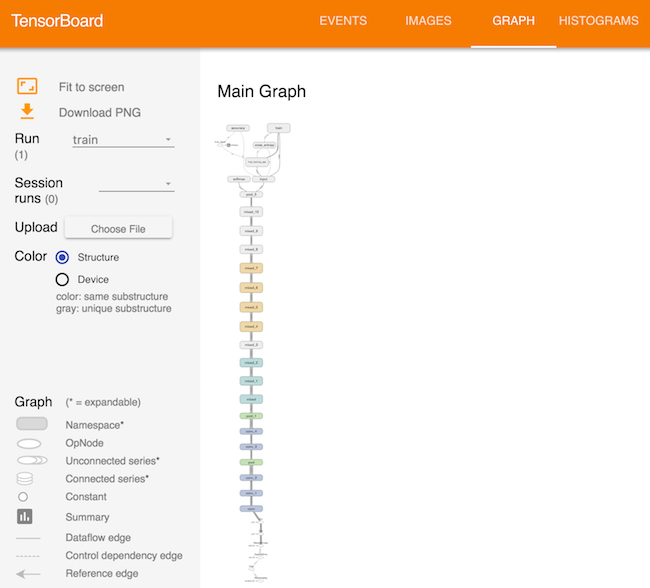
Viewing model architecture in TensorBoard
Selecting the GRAPH tab allows you to view an interactive diagram of the Inception v3 model architecture that was modified for retraining.
Visualizing other TensorFlow models with TensorBoard
Want to visualize other models you create in TensorFlow? You can use the source code I added as a starting point to visualizing your own TensorFlow code with TensorBoard!
Wrapping up
I hope my TensorBoard additions to the TensorFlow image classification retraining tutorial make it easier for you to optimize the retraining process or build your own TensorBoard visualizations! If you have any comments or questions, please feel free to email me at maxmelnick@gmail.com.